![]() Figure 3 of
Liu, Mol Vis 2005;
11:1112-1121.
Figure 3 of
Liu, Mol Vis 2005;
11:1112-1121.
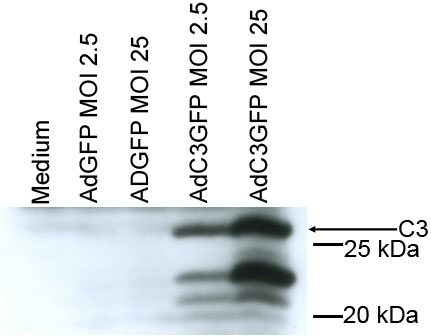
Figure 3. Western blot showing dose-dependent C3 expression in AdC3GFP-transduced cells
Cells were transduced with either AdGFP or AdC3GFP at MOIs of 2.5 or 25, harvested, electrophoresed in denaturing reducing polyacrylamide gels, and blotted with antiserum specific C3 transferase. Control cells (medium) were mock transduced.