![]() Figure 3 of
Berube, Mol Vis 2005;
11:1101-1111.
Figure 3 of
Berube, Mol Vis 2005;
11:1101-1111.
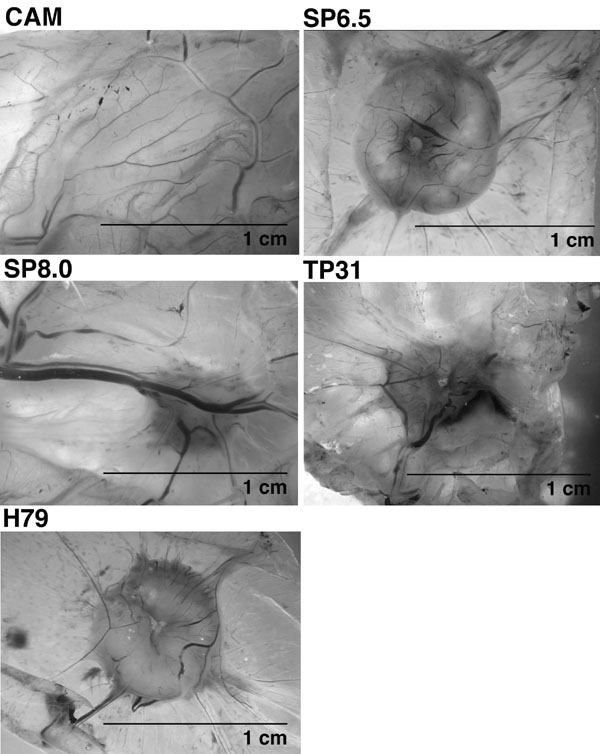
Figure 3. In vivo chick embryo chorioallantoic membrane (CAM) tumor assay
Representative macroscopic views show tumors obtained from the inoculation of SP6.5, TP31, SP8.0, and H79 uveal melanoma cell lines on the CAM of chick embryos. CAM represents control without inoculation. The scale bar represents 1 cm.