![]() Figure 5 of
Gomez-Cabrero, Mol Vis 2005;
11:1071-1082.
Figure 5 of
Gomez-Cabrero, Mol Vis 2005;
11:1071-1082.
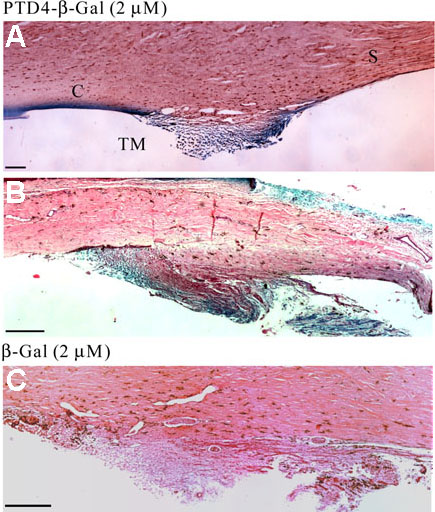
Figure 5. Histological localization of perfused transduction proteins
Paraffin sections of the chamber angle area from anterior segments perfused with 2 μM PTD4-β-Gal or β-Gal. A: After 90 min of control recording in Dulbecco's Modified Eagle's Medium (DMEM) alone, PTD4-β-Gal was perfused for 60 min and then fixed and stained. B,C: PTD4-β-Gal (B) or β-Gal (C) were perfused during 90 min following a washout period of 90 min with control solution. Evident blue staining is seen in the trabecular meshwork (TM) cell layers (A,B). Perfusion with β-Gal did not show significant staining (C). Note that iris and uveal structures were removed, leaving only the trabecular outflow pathway. The scale bars represent 500 μm. B: Outflow facility ratio from the aforementioned experiments. Solid dots correspond to perfusion with PTD4-β-Gal (n=4) for 90 min (horizontal bar). Open dots correspond to perfusion with β-Gal (n=3) for 90 min. Since two anterior segments in each group were fixed at the end of the PTD4-β-Gal or β-Gal period, error bars were not plotted in the washout period. The error bars represent the standard error of the mean.