![]() Figure 3 of
Gomez-Cabrero, Mol Vis 2005;
11:1071-1082.
Figure 3 of
Gomez-Cabrero, Mol Vis 2005;
11:1071-1082.
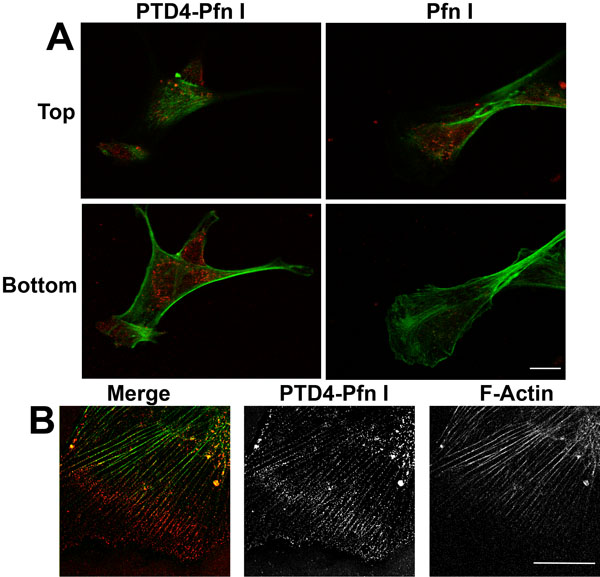
Figure 3. Confocal microscopy analysis of intracellular protein distribution
A: Double immunolabeling for PTD4-Pfn I or Pfn I (red; anti-T7pol antibody) and F-actin (green; Oregon-green phalloidin) in cultured trabecular meshwork cells. PTD4-Pfn I and Pfn I were incubated at a concentration of 2 μM. After 60 min, PTD4-Pfn I showed both membrane (top) and intracellular localization (bottom). Pfn I was only visible at the membrane level. Top and bottom are optical sections of 0.2 μm thick and were 2 μm and 0.5 μm up from the cell bottom, respectively. B: A confocal image at higher magnification showing the intracellular localization of PTD4-Pfn I. The same staining as in A was used. Most of the PTD4-Pfn I staining (red) was present at the leading edges of the cell. The scale bars represent 20 μm.