![]() Figure 2 of
Gomez-Cabrero, Mol Vis 2005;
11:1071-1082.
Figure 2 of
Gomez-Cabrero, Mol Vis 2005;
11:1071-1082.
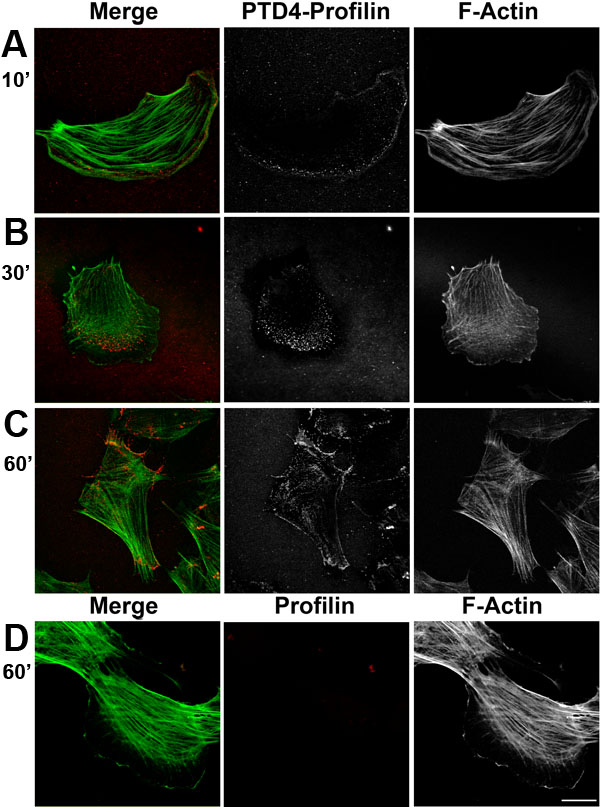
Figure 2. Immunofluorescence analysis of protein uptake in trabecular meshwork cells
Cells were incubated with 2 μM PTD4-Pfn I for 10 (A), 30 (B), and 60 min (C). Control cells were incubated with 2 μM Pfn I without PTD4 for 60 min (D). The left column (Merge) shows double fluorescence staining for PTD4-Pfn I or Pfn I (red; anti-T7pol antibody) and F-actin (green; Oregon-green phalloidin). The middle column shows staining with mouse monoclonal anti-T7pol antibody and the right column shows F-actin staining with Oregon-green phalloidin. The scale bar represents 20 μm.