![]() Figure 3 of
Keiser, Mol Vis 2005;
11:1052-1060.
Figure 3 of
Keiser, Mol Vis 2005;
11:1052-1060.
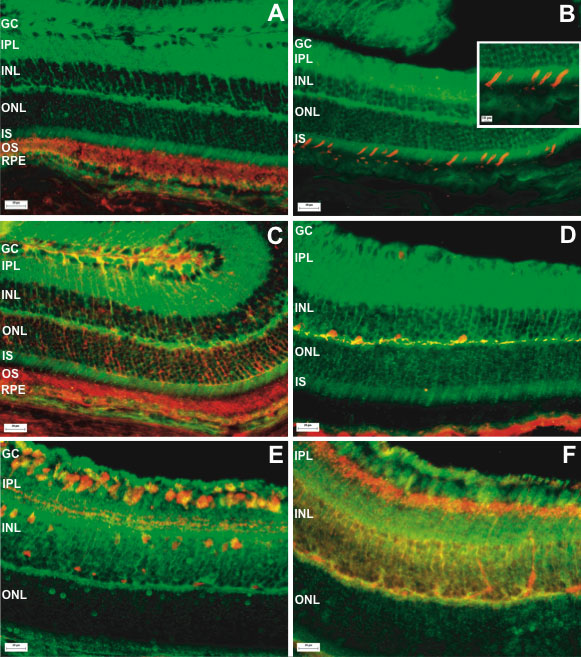
Figure 3. Retinal cell type-specific Rep-1 localization
REP-1 localization is represented in green (Alexa 488), and the expression of the other markers is represented in red (Cy3) in each panel. The following markers were used: rhodopsin (A), PNA (B), CRALBP (C), calbindin D (D), calretinin (E), and PKCα (F). Images of REP-1 localization (40x objective lens) were merged with images of cell-specific marker localization. The inset shows a digitally enlarged area from panel B at the same resolution. Scale bars represent 20 μm (10 μm in inset). The ganglion cell layer (GC), inner plexiform layer (IPL), inner nuclear layer (INL), outer nuclear layer (ONL), inner segments (IS), outer segments (OS), and retinal pigment epithelium (RPE) are identified.