![]() Figure 2 of
Keiser, Mol Vis 2005;
11:1052-1060.
Figure 2 of
Keiser, Mol Vis 2005;
11:1052-1060.
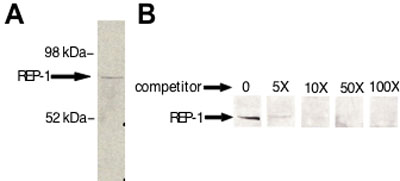
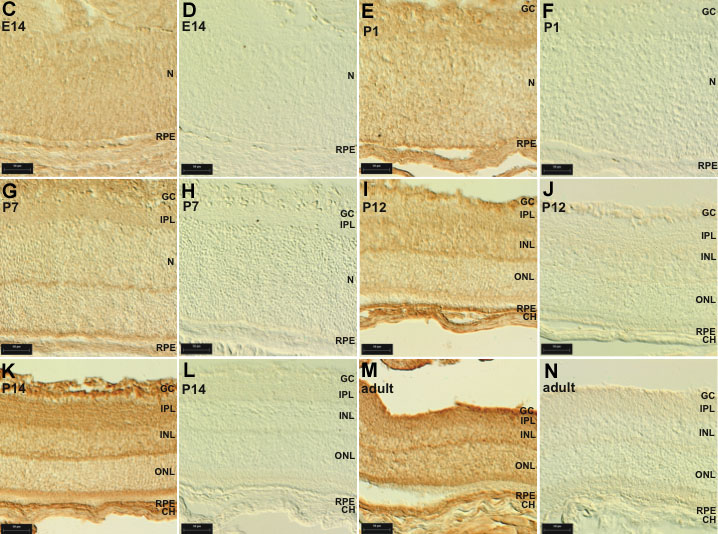
Figure 2. Localization of Rep-1 in the mouse retina
A: Extract from adult (4 months) CD-1 mouse eye was separated by SDS-PAGE and probed with purified antisera (G2373) to mouse REP-1 peptide at a concentration of 1:5000. A single band corresponding to REP-1 was detected and is denoted by the black arrow. Rep-2 migrates at about 75 kDa [36] but was not visible on this blot. B: Increasing amounts of mouse REP-1 peptide were pre-incubated with the G2373 polyclonal antibody prior to probing blots of separated adult (4 months) CD-1 mouse eye extract. The peptide successfully competed out the REP-1 band, denoted by the black arrow. C-N: Immunohistochemistry was performed on cryosections of mouse eyes from different stages of development with the G2373 polyclonal antibody. Staining patterns in the sections were photographed under Nomarski DIC microscopy using a 20x objective lens. Brown staining indicates a positive signal. The developmental stage is denoted on each panel. Sections were incubated with either the G2373 polyclonal antibody (C,E,G,I,K,M) or a control affinity purified rabbit IgG from a non-immunized animal at the same concentration (D,F,H,J,L,N). The scale bars represent 50 μm. The ganglion cell layer (GC), inner plexiform layer (IPL), inner nuclear layer (INL), outer nuclear layer (ONL), retinal pigment epithelium (RPE), neuroblast layer (N), and choroid (CH) are identified.