![]() Figure 4 of
Gupta, Mol Vis 2005;
11:1018-1040.
Figure 4 of
Gupta, Mol Vis 2005;
11:1018-1040.
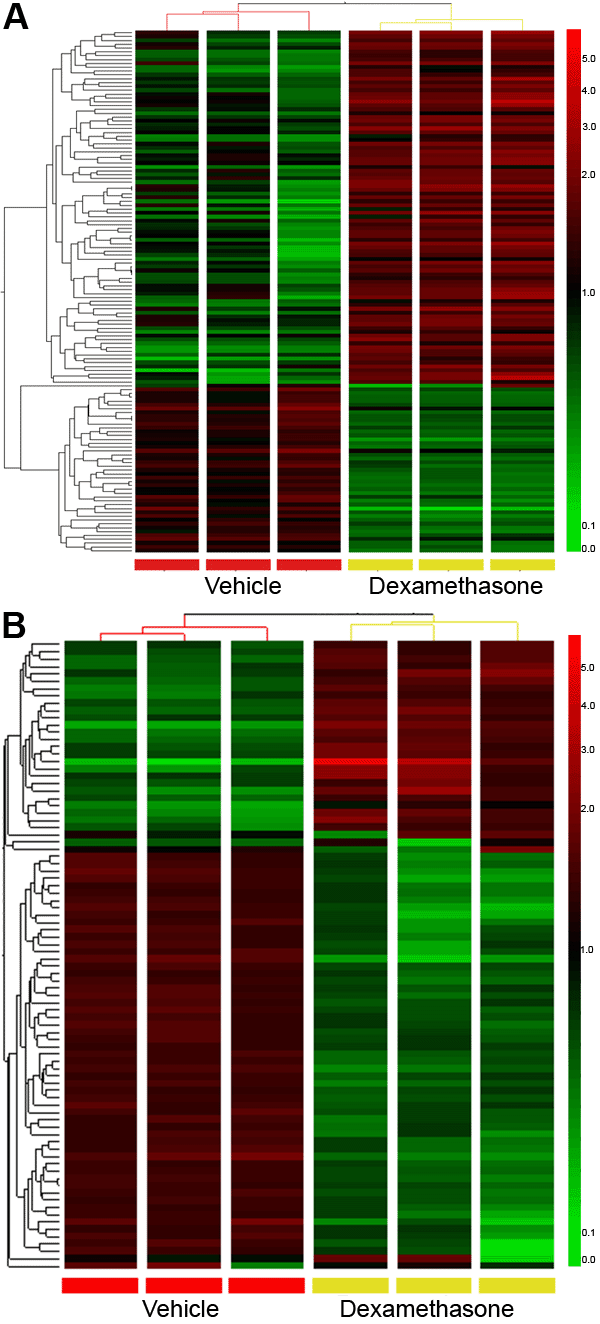
Figure 4. Clustering of microarray data based on condition and expression of genes
The filtered data (genes that change >1.5 fold compared to vehicle) were clustered based on their overall expression. They were also clustered based on their expression across the chips. The triplicates clustered together tightly with treatment and gene changes were present across at least two of three chips. Red denotes transcripts that were upregulated and green denotes transcripts that were downregulated. A: Clustering of 136 genes from 4 h dexamethasone (Dex) treatment of HLE B-3 cells. B: Clustering of 86 genes from 16 h Dex treatment of HLE B-3 cells.
