![]() Figure 8 of
Andrieu-Soler, Mol Vis 2005;
11:1002-1011.
Figure 8 of
Andrieu-Soler, Mol Vis 2005;
11:1002-1011.
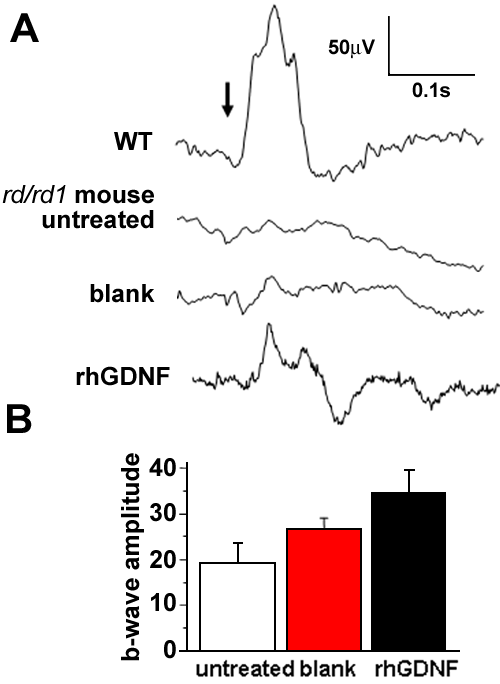
Figure 8. Electroretinograms of treated and control PN23 rd1/rd1 mice
A: Representative averaged recordings from the different animal groups at PN23. An averaged photopic ERG from a wild type adult animal is also shown (WT) to illustrate the difference in amplitude. B: ERG b-wave amplitudes were significantly higher (p=0.01) in the rhGDNF-loaded microspheres (34.4±5.2 μV; n=10) compared to the blank-microsphere treated eyes (26.7±2.4 μV; n=13) and the untreated eyes (19.2±4.3 μV; n=6).
