![]() Figure 1 of
Andrieu-Soler, Mol Vis 2005;
11:1002-1011.
Figure 1 of
Andrieu-Soler, Mol Vis 2005;
11:1002-1011.
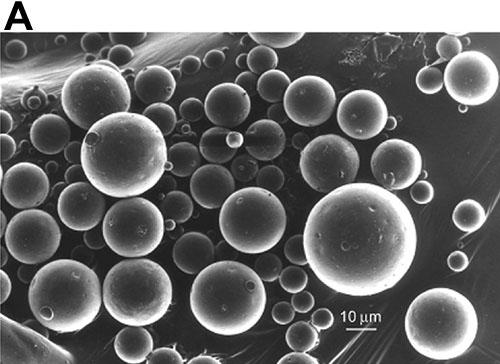
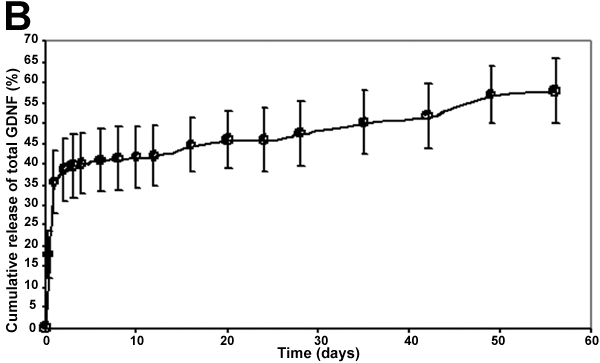
Figure 1. Characteristics of PLGA microspheres
A: Picture of rhGDNF-loaded microspheres analyzed by scanning electron microscopy. Scale bar in A represents 10 μm. B: In vitro cumulative release of 125I-rhGDNF from PLGA microspheres (n=2); error bars represent the standard deviation.