![]() Figure 2 of
Scavello, Mol Vis 2005;
11:97-110.
Figure 2 of
Scavello, Mol Vis 2005;
11:97-110.
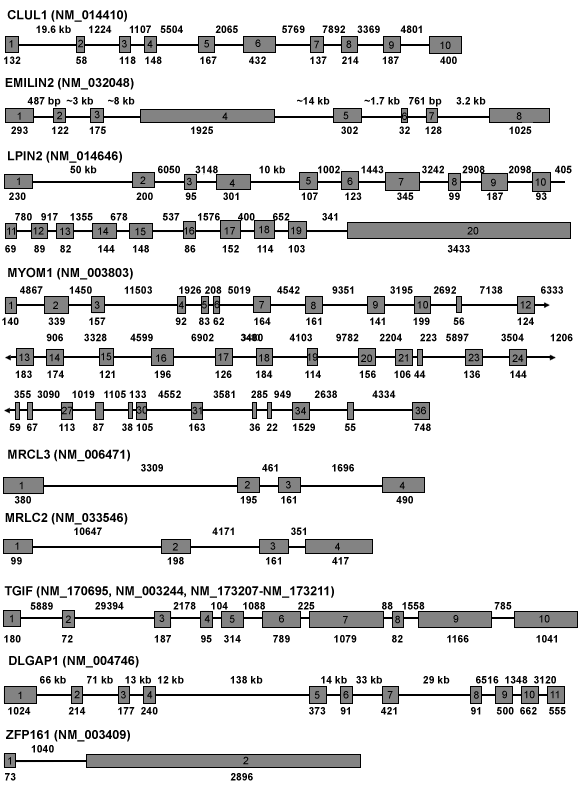
Figure 2. Intron-exon structure of MYP2 candidate genes
A schematic diagram of the exonic structure of the nine candidate genes screened in this study. Exons are represented as squares/rectangles with respective base pair size listed directly below. Intronic size in base pairs are listed between exons.
