![]() Figure 4 of
Mookadam, Mol Vis 2005;
11:909-915.
Figure 4 of
Mookadam, Mol Vis 2005;
11:909-915.
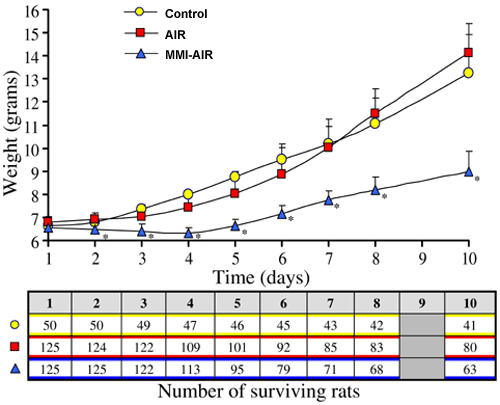
Figure 4. Animal growth
Rat weights (mean±SD) for all neonatal animals in the 10 day experiments where measurements were made daily (5 AIR litters and 5 MMI-AIR litters). Previously published data [6] from 2 untreated non-acidotic control litters are also provided for comparison. Growth retardation was significant in all MMI-AIR rats beginning at day 3 (asterisk represents p<0.005). Number of surviving rats at each day is given in the table below the graph. The first row corresponds to the previously-published control animals [6], the second to the current AIR animals, and the third to the current MMI-AIR animals.
