![]() Figure 6 of
Zhang, Mol Vis 2005;
11:887-895.
Figure 6 of
Zhang, Mol Vis 2005;
11:887-895.
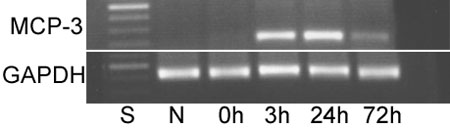
Figure 6. Levels of MCP-3 gene expression by RT-PCR and real-time PCR
A: Gel electrophoresis of RT-PCR products was performed in the pooled light-damaged mouse retinas at different times of dark recovery (S represents standard; N represents normal control). In the retinas of normal mice and mice at 0 h after light exposure, MCP-3 gene expression was undetectable. A marked increase in MCP-3 gene expression was observed at 3 h and 1 day after photic injury. MCP-3 gene expresssion decreased between the 24 h time point to day 3. GAPDH control demonstrates equal amounts of RNA loading. B: Quantitative real-time PCR analysis on the mouse retinas showed significant increase in MCP-3 gene expression at 1 day after intense light exposure. GAPDH mRNA served as a reference for normalization. Data were expressed as the number of copies of MCP-3 transcripts per million copies of GAPDH transcripts. Error bars represent standard deviation.
A:
B: