![]() Figure 2 of
Hoffman, Mol Vis 2005;
11:869-875.
Figure 2 of
Hoffman, Mol Vis 2005;
11:869-875.
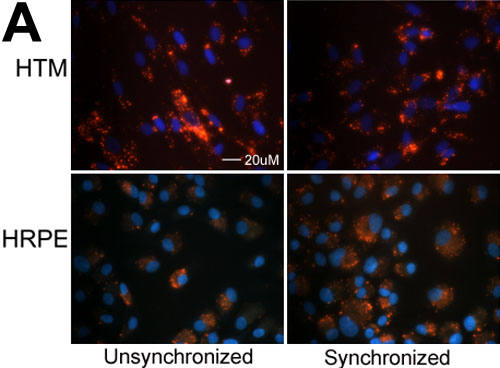
Figure 2. Uptake of plasmid DNA by HTM and HRPE cell cultures
Cells were synchronized by 24 h serum starvation followed by coordinated serum stimulation (10% FBS). After synchronization (18-20 h), cells were transfected with Cy3 labeled plasmid DNA encoding green fluorescent protein (GFP). A: Representative fields to compare DNA uptake by synchronized and unsynchronized cells 19 h after synchronization. B: A graphical summary of DNA uptake by cell type at 19 h after synchronization. A total of 300 cells were counted per condition from digital images captured using epifluorescence microscopy (n=3). No statistical differences were found between synchronized and unsynchronized cells, groups, or cell lines (Student's t-test).