![]() Figure 1 of
Hoffman, Mol Vis 2005;
11:869-875.
Figure 1 of
Hoffman, Mol Vis 2005;
11:869-875.
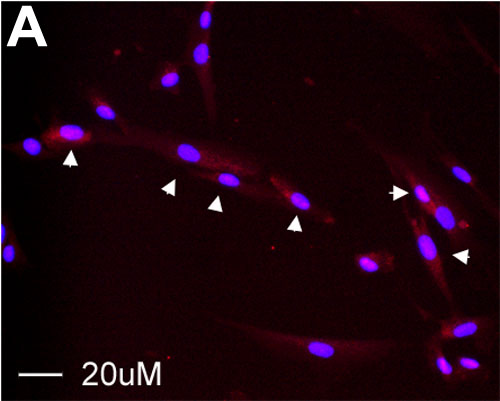
Figure 1. HTM cell cycle analysis by BrdU labeling
HTM cells were treated with 5-Bromo-2'deoxyuridine (BrdU) at 2 h intervals (between 12-26 h) after synchronization by serum stimulation. A: Shown is a representative microscopic field demonstrating BrdU labeling (arrowheads). B: A graphical summary of percentage of HTM cells that labeled with BrdU at different times. BrdU-positive cells were identified using indirect immunofluorescence with anti-BrdU IgG and total cells were indicated by DAPI-stained nuclei. Digital images were taken from random fields for a total of 300 cells per condition (n=2).