![]() Figure 1 of
Devi, Mol Vis 2005;
11:846-852.
Figure 1 of
Devi, Mol Vis 2005;
11:846-852.
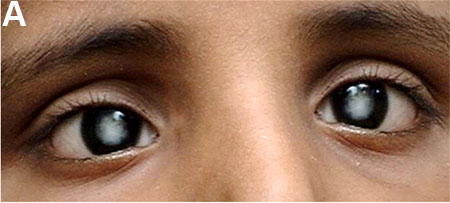
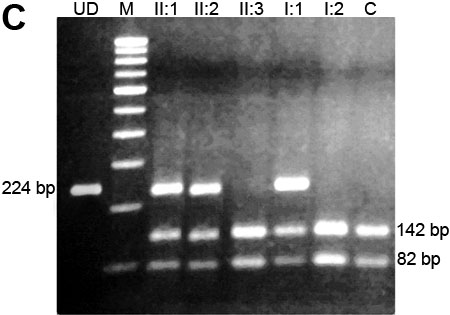
Figure 1. Analysis of family 1
A: Clinical picture of the proband showing total cataract phenotype. B: The pedigree of the proband.The shaded circle (female) and shaded boxes (males) represent the affected members and the unshaded boxes and circles denote the unaffected members in the family. An arrow indicates the proband. C: Restriction endonuclease analysis of the family. Wild type individuals display a 142 bp and 82 bp band while affected individuals, due to the loss of a BseGI site in one of the alleles, display 224 bp, 142 bp, and 82 bp cleavage products. A 100 bp standard molecular weight ladder is in lane M, undigested DNA is in lane UD, and a restriction analysis of an unrelated healthy control is in lane C.