![]() Figure 4 of
Dahlman, Mol Vis 2005;
11:88-96.
Figure 4 of
Dahlman, Mol Vis 2005;
11:88-96.
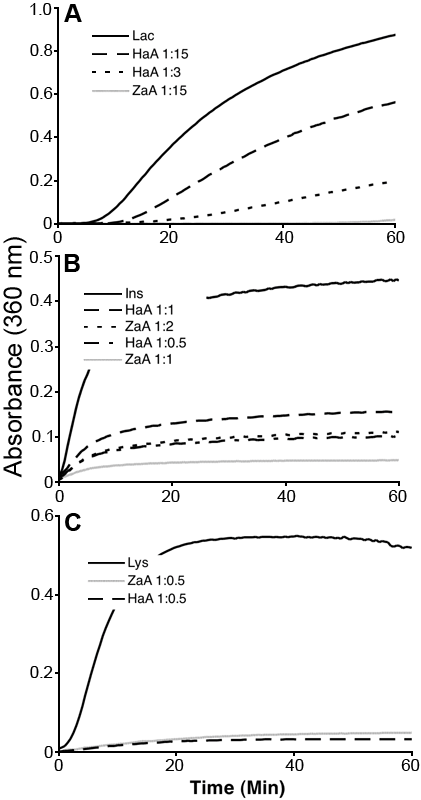
Figure 4. Chaperone-like activity of zebrafish and human αA-crystallin at 37 °C
The target proteins used were 0.6 mg/ml α-lactalbumin (A), 0.4 mg/ml insulin (B) and 0.1 mg/ml lysozyme (C). Curves show the aggregation of α-lactalbumin (Lac), insulin (Ins), or lysozyme (Lys) alone or with varying amounts of zebrafish αA-crystallin (ZaA) or human αA-crystallin (HaA). Shown are the mass ratios of α-crystallin to target protein in each assay. Lower absorbance indicates greater protection from aggregation provided by the crystallins. Reaction buffer conditions are described in Methods.
