![]() Figure 7 of
Larsson, Mol Vis 2004;
10:821-831.
Figure 7 of
Larsson, Mol Vis 2004;
10:821-831.
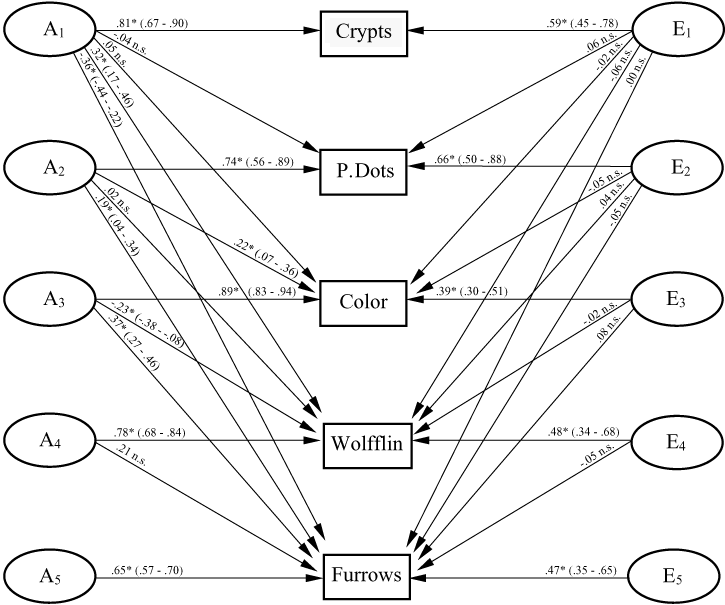
Figure 7. Standardized path coefficients and 95% confidence intervals from Model 2
All paths representing additive genetic and nonshared environmental effects were freely estimated. Shared environmental effects were fixed at 0. Statistically significant (p<0.05; based on a chi-square with 1 df) differences are marked with an asterisk.
