![]() Figure 4 of
Cassar, Mol Vis 2004;
10:808-813.
Figure 4 of
Cassar, Mol Vis 2004;
10:808-813.
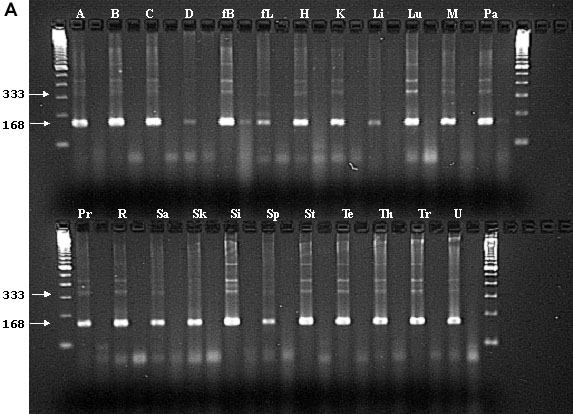
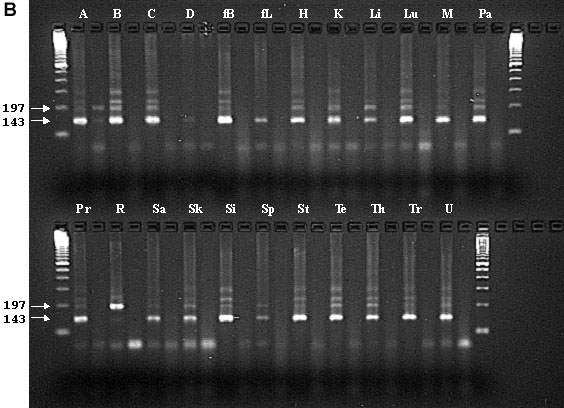
Figure 4. RT-PCR results from various human tissues
A: Products amplified to detect hCNGA3 cDNAs that differ in the region between exon 3 and exon 4. B: Products amplified to detect hCNGA3 cDNAs that differ in the region between exon 4 and exon 7. Tissues shown are adrenal (A), brain (B), cerebellum (C), dorsal root ganglion (D), fetal brain (fB), fetal Liver (fL), heart (H), kidney (K), liver (Li), lung (Lu), mammary (M), pancreas (Pa), prostate (Pr), retina (R), salivary gland (Sa), skeletal muscle (Sk), small intestine (Si), spleen (Sp), stomach (St), testes (Te), thymus (Th), trachea (Tr), uterus (U). Tissues are from adults, unless otherwise indicated. The negative control products are run next to the actual sample for each tissue. Arrows indicate positions of expected products from alternative splice forms. The markers, shown in the first and last lanes, are 100 bp DNA Ladders (Invitrogen).