![]() Figure 8 of
Liang, Mol Vis 2004;
10:773-786.
Figure 8 of
Liang, Mol Vis 2004;
10:773-786.
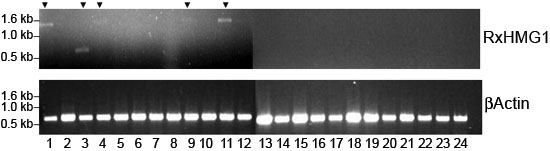
Figure 8. Expression profile of RxHMG1 in adult organs and embryonic tissues
The upper gel shows the PCR products obtained with the RxHMG1 (Rx-3201-21) primers shown in Table 1. The bottom gel shows PCR products obtained with β-actin specific primers. Arrowheads indicate the organs/tissues where RxHMG1 shows detectable expression. Lane 1: brain. Lane 2: heart. Lane 3: kidney. Lane 4: spleen. Lane 5: thymus. Lane 6: liver. Lane 7: stomach. Lane 8: small intestine. Lane 9: skeletal muscle. Lane 10: lung. Lane 11: testis. Lane 12: skin. Lane 13: adrenal gland. Lane 14: pancreas. Lane 15: uterus. Lane 16: prostate gland. Lane 17: E8.5 embryo. Lane 18: E9.5 embryo. Lane 19: E12.5 embryo. Lane 20: E19 embryo. Lane 21: breast (virgin). Lane 22: breast (pregnant). Lane 23: breast (lactating). Lane 24: breast (involuting).