![]() Figure 4 of
Tasheva, Mol Vis 2004;
10:758-772.
Figure 4 of
Tasheva, Mol Vis 2004;
10:758-772.
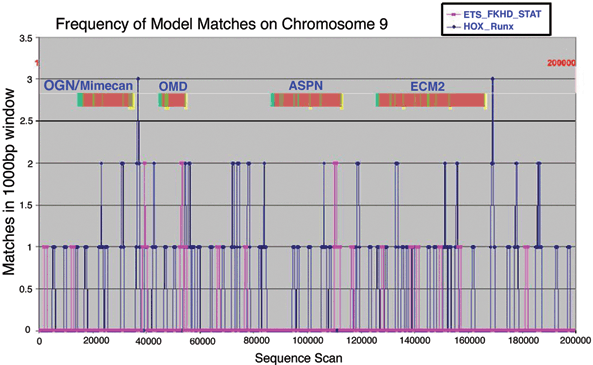
Figure 4. Frequency of the HOX-Runx and ETS-FKHD-STAT model matches on human chromosome 9
Distribution of the HOX-Runx, and ETS-FKHD-STAT matches on the analyzed 200 kb region of human chromosome 9. A sliding window of 1,000 bp with steps of 100 bp was used. Matches within the window were counted and a graphical plot of matches per 1,000 bp window versus sequence position is shown. Positions of genes within the chromosomal region were superimposed to easily identify intergenic regions.
