![]() Figure 2 of
White, Mol Vis 2004;
10:738-749.
Figure 2 of
White, Mol Vis 2004;
10:738-749.
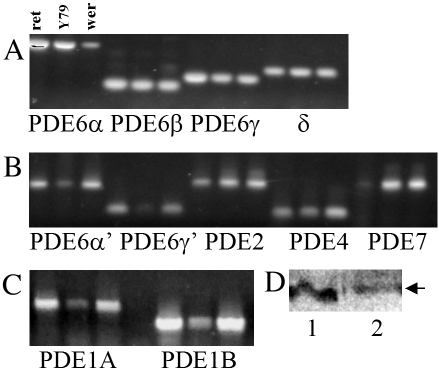
Figure 2. PCR amplification and quantitative analysis of retina, Y79, and WERI cDNA
RT-PCR amplification with PDE family specific primer sets. Shown in A are RT-PCR products amplified with primers specific for rod PDE6 transcripts, α, β, γ and PDE6 associated δ. B shows RT-PCR products using primers specific for cone PDE6 transcripts (α', γ'), PDE2, PDE4, and PDE7. RT-PCR products using primers specific for PDE1A and PDE1B are shown in C. For A, B, and C results are shown for each primer set in three lanes loaded with amplification product human retina, Y79, and WERI from left to right. D shows western analysis of PDE1 isozymes. Pooled fractions containing PDE activity from peaks 1 (lane 1) and 2 (lane 2) were fractionated and transferred to a solid support. An antibody recognizing all three isoforms of PDE1 was used revealing a signal at a molecular weight (arrow, about 60 kDa) consistent with the size of PDE1A [46]. E: Semi-quantitative analysis of transcripts in retina and Rb cells. The relative amount of each PCR product in the linear phase of amplification was determined and normalized to GAPDH. Cone PDEα' transcript could not be detected in Y79 cells in 20-25 cycles used to generate the other product, but was apparent in 35 cycles. Error in measurement is shown as SEM.