![]() Figure 5 of
Nakamura, Mol Vis 2004;
10:703-711.
Figure 5 of
Nakamura, Mol Vis 2004;
10:703-711.
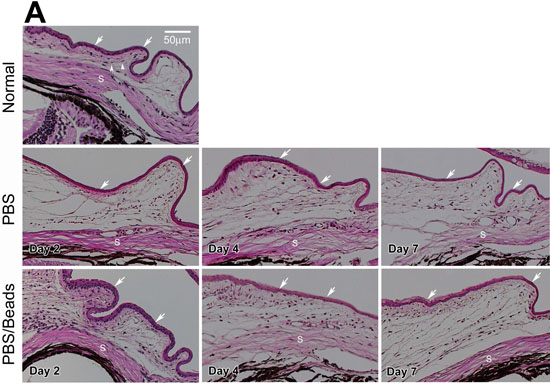
Figure 5. Inflammatory response in mouse models
A: Tissue sections from a normal mouse eye. An eye injected with PBS alone, and an eye injected with PBS mixed with latex beads was stained with hematoxylin and eosin to assess cellularity. Note the long, spindle shaped fibroblasts (arrowheads) underneath the conjunctival epithelium (arrows) in the normal mouse eye. Infiltration of the large, round inflammatory cells was observed in mouse eyes 2, 4, and 7 days after injection with either PBS alone or with PBS/beads. The S indicates the sclera. The bar represents 50 μm. B: Bar graph showing the number of inflammatory cells per 2,500 μm2 of subconjunctival area in eyes 2, 4, and 7 days after being injected with PBS alone or with PBS/beads. The data are presented as means (n=8 for day 2 and n=4 for days 4 and 7); error bars represent the standard error of the mean. Asterisks indicate values significantly different from those in PBS injected eyes (p<0.011).