![]() Figure 4 of
Nakamura, Mol Vis 2004;
10:703-711.
Figure 4 of
Nakamura, Mol Vis 2004;
10:703-711.
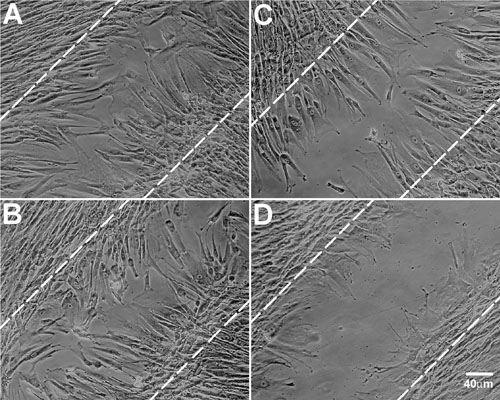
Figure 4. TβRII siRNA blocks corneal fibroblast migration
Phase contrast micrographs demonstrating migration of control cells (A), cells treated for 48 h with scrambled siRNA (B), cells treated for 48 h with 100 nM hT1 (C), or cells treated for 48 h with 200 nM hT1 (D). White dotted lines mark the wound edges. E: Bar graph showing mean percentage of wound area covered by migrating corneal fibroblasts in each specimen (n=10); error bars represent the standard error of the mean. Asterisks denote values significantly different from those of scrambled RNA treated controls (p<0.0001). Experiments were repeated 3 times, yielding similar results.