![]() Figure 3 of
Nakamura, Mol Vis 2004;
10:703-711.
Figure 3 of
Nakamura, Mol Vis 2004;
10:703-711.
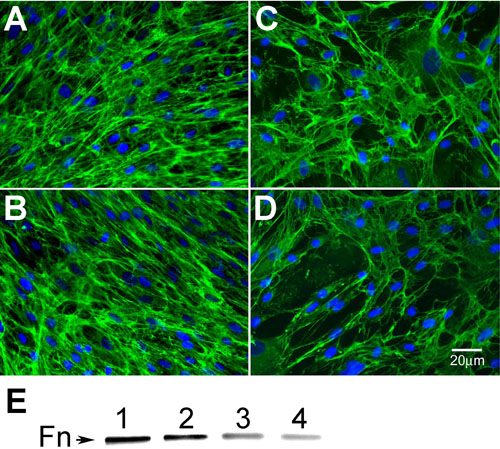
Figure 3. TβRII siRNA interferes with fibronectin production
Immunofluorescence analysis of fibroblasts untreated (A), treated for 48 h with scrambled siRNA (B), 100 nM hT1 (C), or 200 nM hT1 (D) was performed to visualize the fibronectin matrix (in green). Nuclei stained with DAPI are seen in blue. E: The level of fibronectin secreted to the culture media was analyzed by western blotting. Samples were from cultures untreated (lane 1), treated with scrambled RNA (lane 2), or 100 nM (lane 3) or 200 nM (lane 4) hT1. The fibronectin (Fn) bands are labeled.