![]() Figure 4 of
Elias, Mol Vis 2004;
10:672-681.
Figure 4 of
Elias, Mol Vis 2004;
10:672-681.
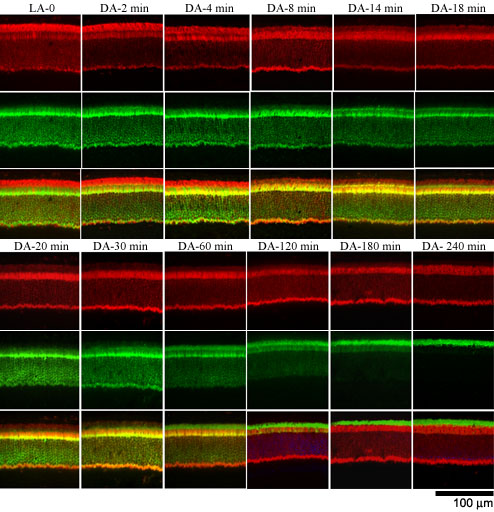
Figure 4. Light to dark temporal translocation of arrestin and rod α-T
Temporal translocation of Arrestin and rod α-T in the albino mouse retina in response to dark adaptation for times of 0, 2, 4, 8, 14, 18, 20, 30, 60, 120, 180, and 240 min was measured. The images for each time point are of the same section viewed with a filter to detect Transducin (green, top row), arrestin (red, middle row) or a triple filter for Transducin, arrestin and DAPI stained nuclei (blue, bottom row). Maximal translocation of arrestin (red) from ROS to RIS occurs within 30 min in the dark whereas α-T (green) takes more than 200 min to translocate from RIS to ROS. The scale bar represents 100 μm.