![]() Figure 2 of
Elias, Mol Vis 2004;
10:672-681.
Figure 2 of
Elias, Mol Vis 2004;
10:672-681.
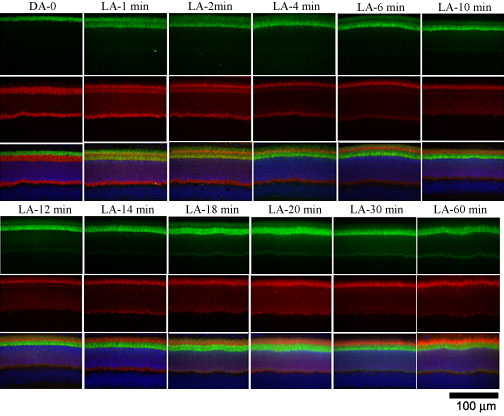
Figure 2. Dark to light temporal translocation of arrestin and rod α-T
Translocation of Arrestin and α-T in albino mouse retinal sections in response to exposure to 600 lux of light for indicated times. The images for each time point are of the same section viewed with a filter to detect Transducin (green, top row), arrestin (red, middle row) or a triple filter for Transducin, arrestin and DAPI stained nuclei (blue, bottom row). The majority of the α-T (green) has translocated from the ROS to the RIS within 2 min of light exposure. Arrestin (red) is seen to initially concentrate as a band at the base of the ROS followed by almost complete translocation from RIS to ROS within 6-8 min of light exposure. The scale bar represents 100 μm.