![]() Figure 3 of
Pasta, Mol Vis 2004;
10:655-662.
Figure 3 of
Pasta, Mol Vis 2004;
10:655-662.
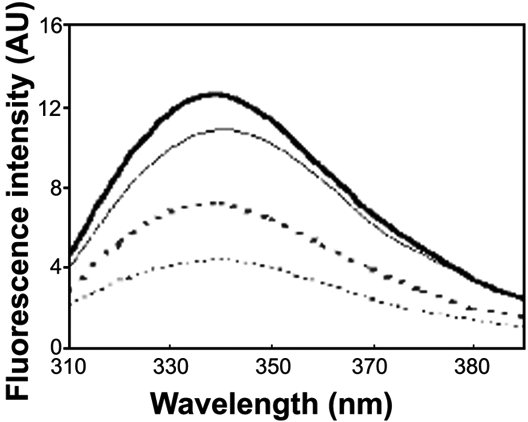
Figure 3. Fluorescence spectra of wild type and mutant α-crystallins
Intrinsic fluorescence spectra of the wild type and mutant α-crystallins at 0.15 mg/ml. αA-crystallin (thick dotted line), αAgxg-crystallin (thin dotted line), αB-crystallin, (thick solid line), and αBgxg-crystallin (thin solid line).