![]() Figure 2 of
Wu, Mol Vis 2004;
10:650-654.
Figure 2 of
Wu, Mol Vis 2004;
10:650-654.
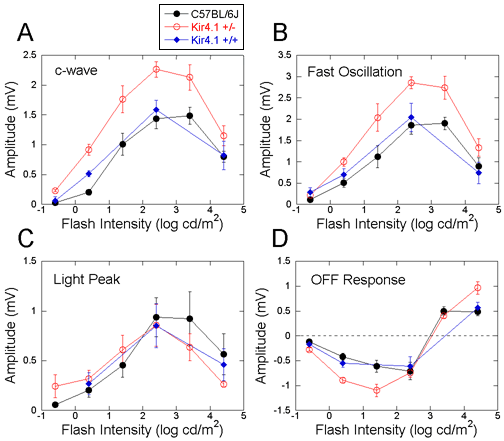
Figure 2. Intensity response functions for the amplitude of the major ERG components generated by the RPE in response to light
The different panels plot the amplitude of the c-wave (A), fast oscillation (B), light peak (C), or off response (D) as a function of flash intensity (black line, C57BL/6J; red line, Kir4.1+/-; blue line, Kir4.1+/+). Data points indicate the average of 3 to 8 responses obtained from different mice; the error bars represent the standard error of the mean. Note that Kir4.1+/+ mice were tested using only a subset of the stimulus intensities.
