![]() Figure 1 of
Wu, Mol Vis 2004;
10:650-654.
Figure 1 of
Wu, Mol Vis 2004;
10:650-654.
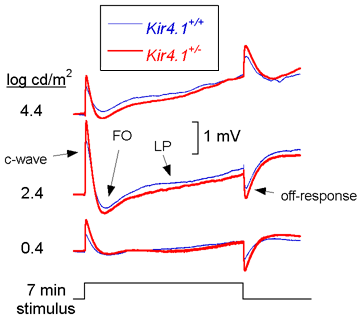
Figure 1. Comparison of ERGs obtained to 7 min stimuli from control and Kir4.1 mutant mice
ERGs recorded to 7 min duration stimulus flashes from Kir4.1+/+ (thin blue tracings) or Kir4.1+/- (thick red tracings) mice. Each record indicates the grand average of 3 Kir4.1+/+ or 8 Kir4.1+/- mice. The stimulus intensity used to evoke these responses is indicated on the left. Stimulus presentation is represented by the lower trace. Amplitude calibration indicates 1 mV.