![]() Figure 4 of
Hackam, Mol Vis 2004;
10:637-649.
Figure 4 of
Hackam, Mol Vis 2004;
10:637-649.
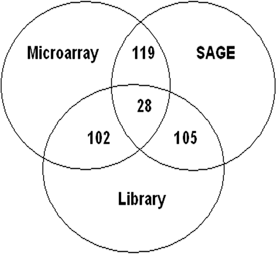
Figure 4. Venn diagram showing overlap of genes identified by three different methodologies
Retina enriched genes identified by the custom microarray using retina-brain and retina-liver comparisons were compared to SAGE and library retina enriched datasets generated by t test analysis. The top 1134 retina-enriched genes detected by each method were compared. Only a limited number of genes were found to be in common, indicated in the overlapping regions in the diagram.
