![]() Figure 1 of
Hackam, Mol Vis 2004;
10:637-649.
Figure 1 of
Hackam, Mol Vis 2004;
10:637-649.
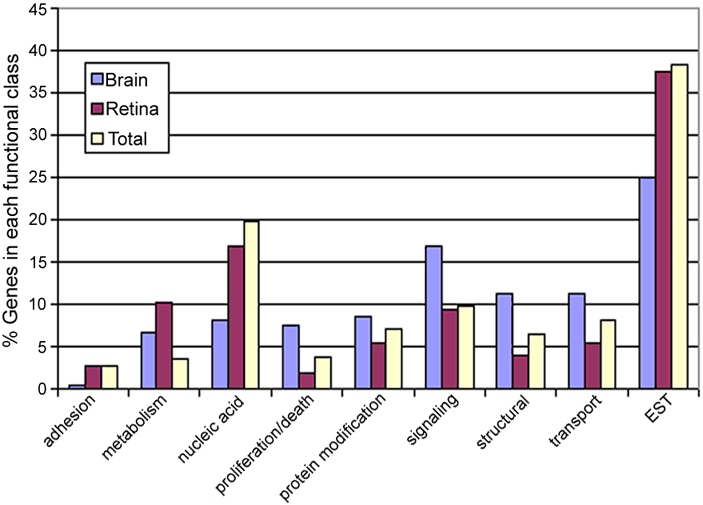
Figure 1. Functional group analysis of differentially expressed genes
Functional annotation of retina and brain enriched genes identified by hybridization to the custom cDNA microarrays, compared with the annotation of clones on the entire array ("Total"). Shown are the functional classifications of a subset of differentially expressed that were selected by SAM and had expression ratios greater than 1.4 fold.
