![]() Figure 1 of
Fernandes, Mol Vis 2004;
10:618-628.
Figure 1 of
Fernandes, Mol Vis 2004;
10:618-628.
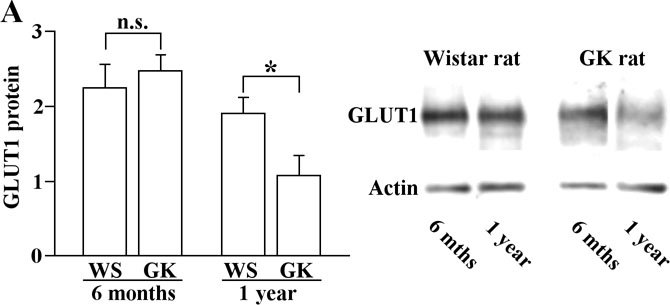
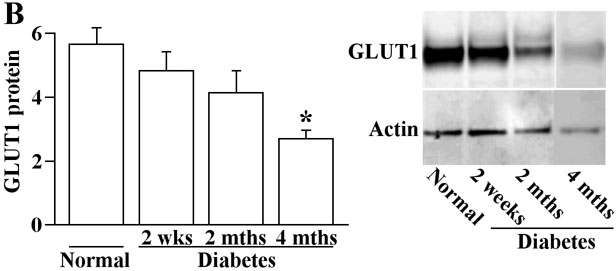
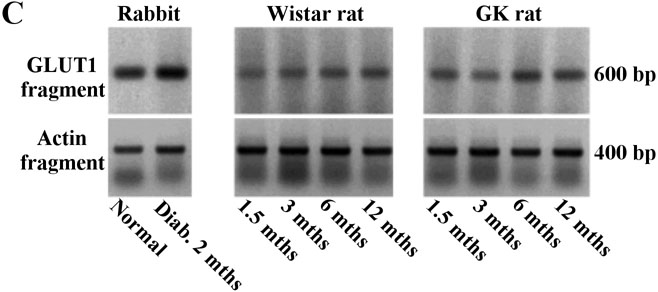
Figure 1. Effect of diabetes on GLUT1 expression in retina
A: GLUT1 protein expression in retina from 1 year old nondiabetic rats is greater than in age matched diabetic GK rats. Membrane fractions were isolated from rat retinas. Equal amounts of protein (30 μg) were subjected to immunoblotting and membranes were probed with anti-GLUT1 antibodies. Actin expression on the same membrane is included to demonstrate comparable loading of lanes. Graphical summary and western blots are provided. Bars represent standard errors (4 rats/group). The asterisk (*) indicates that the GLUT1 protein expression for 1 year old diabetic GK rats are stastically different from the age matched control Wistar rats (p<0.05). B: GLUT1 protein expression in diabetic rabbit retinas is decreased compared to controls. The duration of diabetes was 2 weeks, 2 and 4 months. Membrane fractions were isolated from rabbit retinas. Equal amounts of protein (5 μg) were subjected to immunoblotting and probed with antibodies directed against GLUT1 and actin. Western blots are provided. The graphic represents the results normalized for actin. Bars represent standard errors (5 rabbits/group). The asterisk (*) indicates that the GLUT1 protein expression for rabbits with-diabetes for 4 months are significantly different from the the control rabbits (p<0.01). C: Slight increase on retinal GLUT1 mRNA levels in diabetic animals. Total retinal RNA (1 μg or 150 ng) was subjected to RT-PCR analysis for determination of GLUT1 and actin mRNA levels.