![]() Figure 6 of
Ohashi, Mol Vis 2004;
10:608-617.
Figure 6 of
Ohashi, Mol Vis 2004;
10:608-617.
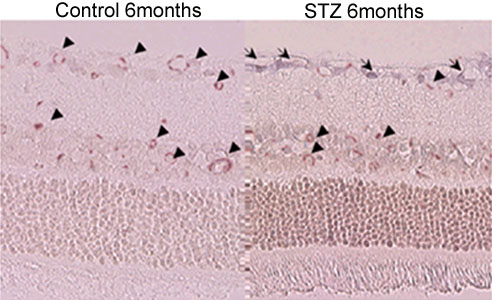
Figure 6. In situ hybridization analysis of Ang-2 expression followed by co-staining with anti-αSMA antibody
Control and 6 months diabetic animals were compared. Ang-2 mRNA expression were observed in the GCL and the INL (arrow head) in control animals and was increased in these layer by diabetes. αSMA positive cells were stained in the GCL and the INL (arrow). In diabetic rats, αSMA positive staining decreased compared to non-diabetic rats specifically in regions surrounding Ang-2 overexpressing cells.