![]() Figure 5 of
Ohashi, Mol Vis 2004;
10:608-617.
Figure 5 of
Ohashi, Mol Vis 2004;
10:608-617.
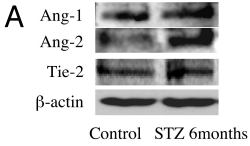
Figure 5. Western blot analysis to determine Ang-1, Ang-2 and Tie-2 protein expression in 6 months diabetic and control retinas
Lane loading was normalized by reblotting with a monoclonal anti-β-actin antibody. A: Representative bands of western blot analyses. B: Relative expression levels of Ang-1, Ang-2 and Tie-2 protein (n=4). Black columns; diabetic retina at 6 months after STZ induction, White columns; age matched non-diabetic retina. An asterisk ("*") indicates p<0.05 compared to Ang-2 protein expression level of non-diabetic retina. In contrast to Ang-1 and Tie-2, Ang-2 protein level was selectively upregulated 6 months after STZ injection. C: Real-time PCR analyses of retinal mRNA expression of VEGF in the diabetic and non-diabetic control retinas (n=4). Double asterisks ("**") indicate p<0.05 compared to VEGF mRNA expression level of non-diabetic retina. VEGF mRNA was significantly upregulated in 6 months diabetic retinas.