![]() Figure 4 of
Ohashi, Mol Vis 2004;
10:608-617.
Figure 4 of
Ohashi, Mol Vis 2004;
10:608-617.
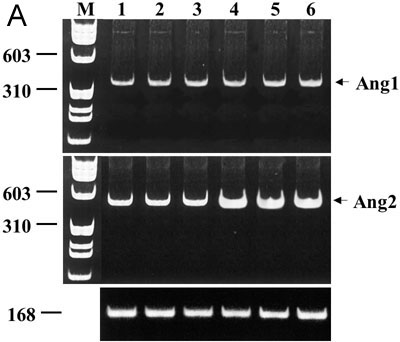
Figure 4. RT-PCR experiments to determine Ang-1 and Ang-2 gene expression in 6 months diabetic and control retinas
PCR was performed using (A, top) Ang-1 primers and (A, middle) Ang-2 primers after cDNA concentration was normalized to (A, bottom) β-actin gene expression. PCR products of expected lengths (Ang-1: 372 bp and Ang-2: 453 bp) were obtained (arrow). Lane 1-3: non-diabetic control rats; lane 4-6; diabetic rats; Lane M: X174/HaeIII marker. B: Relative intensities of PCR bands (top: Ang-1, bottom: Ang-2). In contrast to Ang-1, retinal expression of Ang-2 increased 6 months after STZ injection. An asterisk ("*") indicates p<0.0005 compared to control.