![]() Figure 1 of
Ohashi, Mol Vis 2004;
10:608-617.
Figure 1 of
Ohashi, Mol Vis 2004;
10:608-617.
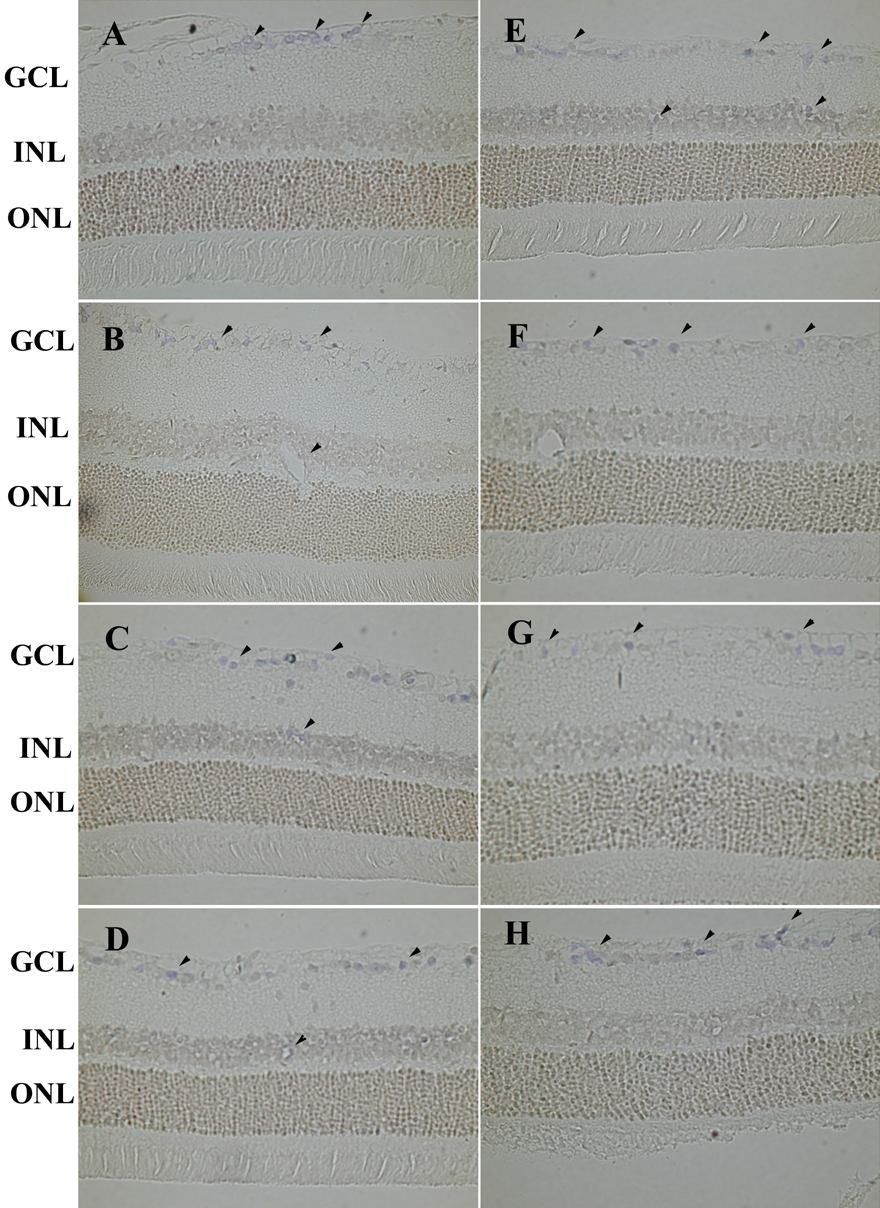
Figure 1. In situ hybridization analysis of Ang-1 during the development of diabetes
A-D: the retinas of STZ induced diabetic rats. E-H: the retinas of saline injected non-diabetic control rats. A,E: 2 weeks after injection. B,F: 1 month later after injection, C,G: 3 months after injection. D,H: 6 months later after injection. Weak Ang-1 mRNA expression was observed in the GCL and the INL (arrow heads). The intensity of Ang-1 mRNA expression was unchanged between diabetic and non-diabetic rats from 2 weeks to 6 months following STZ injection.