![]() Figure 4 of
Simon, Mol Vis 2004;
10:588-597.
Figure 4 of
Simon, Mol Vis 2004;
10:588-597.
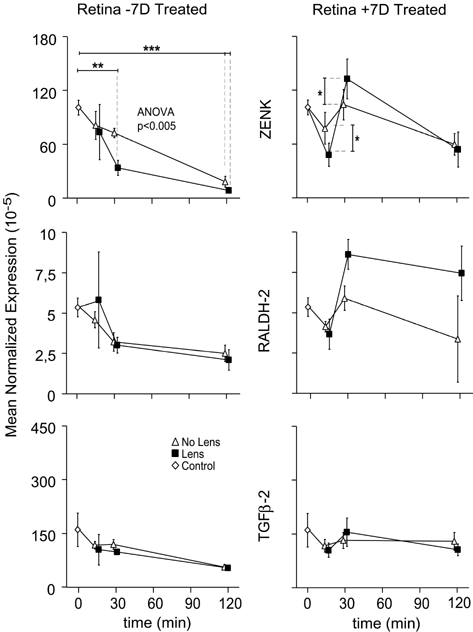
Figure 4. Differential gene expression following defocus in the retina
Changes of the mean normalized expression (MNE) values and the respective standard error of the mean in the retina over time, for the three studied transcripts (3 animals for 15, 30, and 120 min; "No Lens", contralateral control eyes, open triangles; "Lens", ipsilateral lens treated eyes, filled squares; "Control", six eyes of three untreated animals, open diamonds). Data obtained during treatment with negative lenses are shown on the left and with positive lenses on the right. Statistically significant differences between controls at zero minutes and the various treatment groups were determined by REST and are indicated by asterisks next to the horizontal lines (double asterisks p<0.01, triple asterisks p<0.001). Differences between the "No Lens" and "Lens" group at any given time point were tested for significance by paired t tests. Significant differences are indicated by asterisks next to the vertical lines (single asterisks p<0.017). Omission of a statement regarding ANOVA testing indicates that the test was not significant.
