![]() Figure 3 of
Simon, Mol Vis 2004;
10:588-597.
Figure 3 of
Simon, Mol Vis 2004;
10:588-597.
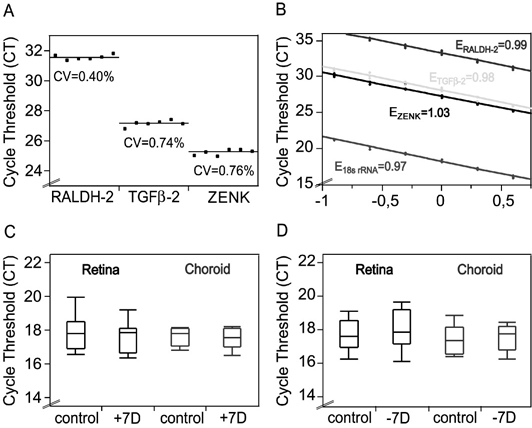
Figure 3. The variation of reverse transcription, efficiency of PCR amplification and stability of housekeeping gene expression
A: Six subsets of the same RNA sample were reverse transcribed and the average CT values determined by real time PCR. The mean CT values from five replicates are presented as single dots, their averages as lines. The respective CV values which describe the variation of the reverse transcription are given as numbers. B: Three CT values for the transcripts and for the housekeeping gene were determined for six dilutions of cDNA sample and plotted against the negative logarithm of the sample concentration. C,D: The scatter of CT values for the housekeeping gene 18S RNA are illustrated by quantiles box plots. The mRNA concentration of the housekeeping gene was unchanged in retina and choroid after treatment with positive lenses (C) and negative lenses (D), as compared to the control conditions (n=9, for all groups).
