![]() Figure 2 of
Simon, Mol Vis 2004;
10:588-597.
Figure 2 of
Simon, Mol Vis 2004;
10:588-597.
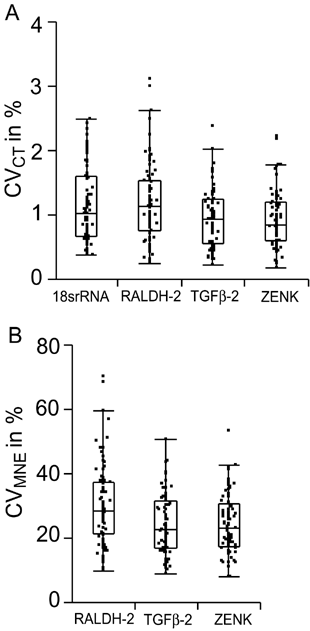
Figure 2. Coefficients of variation for raw data and for the calculated mean normalized expression values
Coefficients of variations (CVs) are shown in a combined point scatter and quantile box plot for 84 quintet replicates for the raw data CT values of each generated amplicon (A) and for the derived mean normalized expression (MNE) values (B). Each individual data point represents a CV of one of the 84 quintet replicates. The middle line of the boxes represent the median CV, the upper and lower limits of the boxes the 75% and 25% quantiles, and the upper and lower lines the 90% and 10% levels. The CV values of the raw data are scattered around 1% and are about 20 fold smaller than the MNE values.
