![]() Figure 1 of
Simon, Mol Vis 2004;
10:588-597.
Figure 1 of
Simon, Mol Vis 2004;
10:588-597.
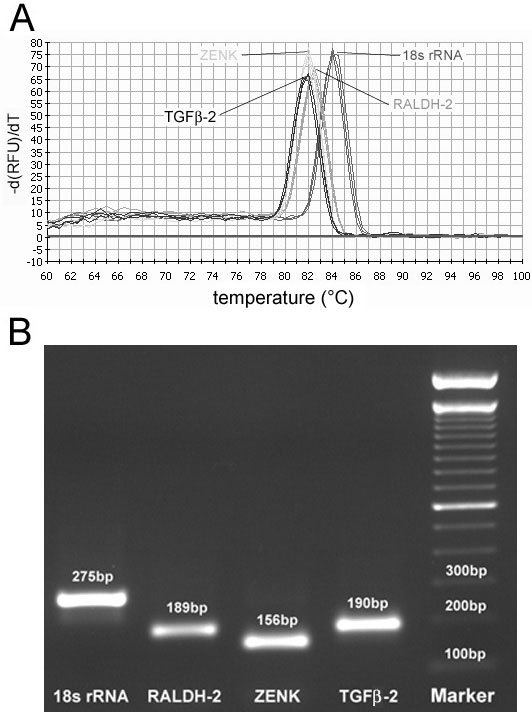
Figure 1. Melting curves and agarose gels of amplicons
A: Melting curves of five replicates for each of the investigated transcripts. Amplification resulted in single peaks at the characteristic temperature. B: Ethidium bromide stained 2% agarose gel showing single bands with characteristic bp lengths for the four amplicons. This gel is not truncated at the bottom. Since the bands are so bright, the very faint bands originating from primer-dimer formation were almost invisible.