![]() Figure 7 of
Jablonski, Mol Vis 2004;
10:577-587.
Figure 7 of
Jablonski, Mol Vis 2004;
10:577-587.
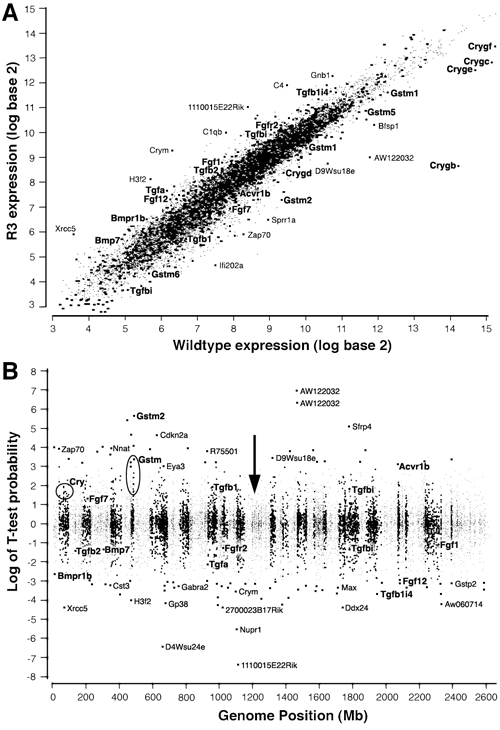
Figure 7. Comparative transcript mapping of whole eyes from RIIIS/J and wildtype mice
A contrasts the expression levels between the mutant and wildtype mice. B plots t-test scores (Y-axis) versus Genome location (X-axis; chromosome 1 to far left and chromosome Y to far right). Transcripts with a positive value indicate those that are expressed at a higher level in the wildtype controls while those with a negative value are higher in the RIIIS/J mutant mice. The arrow indicates location of the ldis1 gene. In both panels, several γ-crystallins, TGF superfamily members, and GST transcripts that are significantly different in RIIIS/J eyes are highlighted in a bold and slightly larger font. Other transcripts are also noted.
