Figure 4 of de Iongh, Mol Vis 2004; 10:566-576.
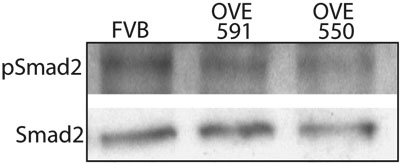
Figure 4. Expression of phosphorylated Smad2 in FVB and Tg lenses
Western blots showing reduced amounts of phosphorylated Smad2 compared to total Smad2 in transgenic OVE550 and OVE591 lenses.