![]() Figure 3 of
Tomi, Mol Vis 2004;
10:537-543.
Figure 3 of
Tomi, Mol Vis 2004;
10:537-543.
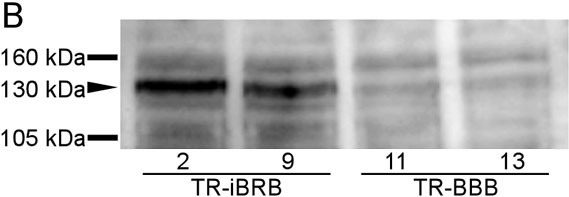
Figure 3. Expression of rat M-cadherin in TR-iBRB and TR-BBB cells
A: Quantitative real time PCR analysis of rat M-cadherin. The rat M-cadherin mRNA expression level was normalized by the GAPDH mRNA expression. Each point represents the mean of 3-4 observations. The error bars represent the standard error of the mean. An asterisk ("*") indicates p<0.01 for the comparison to TR-iBRB2 cells. A sharp sign ("#") indicates p<0.01 for the comparison to TR-iBRB9 cells. B: Immunoblot analysis of rat M-cadherin. One representative immunoblot analysis from three independent experiments is shown.