![]() Figure 5 of
McColm, Mol Vis 2004;
10:512-520.
Figure 5 of
McColm, Mol Vis 2004;
10:512-520.
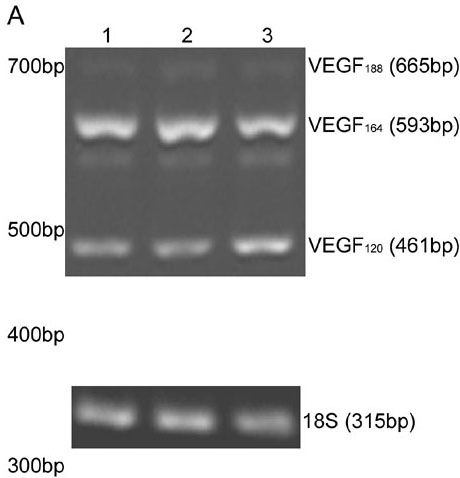
Figure 5. Comparison of a single episode of hypoxia to continuous variable oxygen on the expression of VEGF isoforms
A: RT-PCR analysis of VEGF isoform mRNAs in P14 RA control (lane 1), P14 RA control after 24 h of 10% oxygen (lane 2), and P14 50/10 OIR model that had 7 cycles of 24 h of 50% oxygen followed by 24 h of 10% oxygen (lane 3). B: Densitometry measurements using 18S RNA as the control gene. PCR was repeated three times on different experiments and this result is representative. Samples were assayed in triplicate and error bars are standard deviations. An asterisk ("*") indicates p<0.01 compared to control (t test).