![]() Figure 2 of
McColm, Mol Vis 2004;
10:512-520.
Figure 2 of
McColm, Mol Vis 2004;
10:512-520.
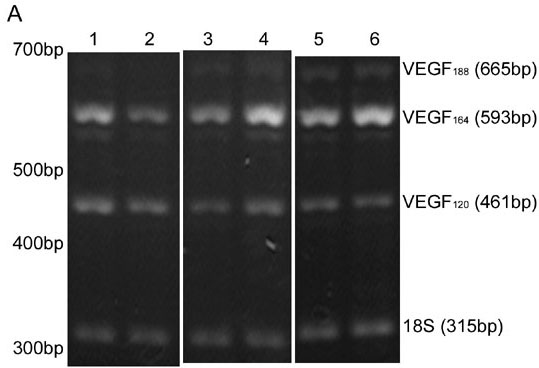
Figure 2. Variable oxygen effect on VEGF isoform expression
A: RT-PCR analysis of VEGF mRNA from whole homogenized retina. P7 room air raised controls (lane 1); P7 50/10 OIR model that had 3.5 cycles of 24 h of 50% oxygen followed by 24 h of 10% oxygen (lane 2); P14 RA controls (lane 3); P14 50/10 OIR model that had 7 cycles of 24 h of 50% oxygen followed by 24 h of 10% oxygen (lane 4); P18 RA controls (lane 5); P18 50/10 OIR model that had 7 cycles of 24 h of 50% oxygen followed by 24 h of 10% oxygen followed by 4 days in room air (lane 6). PCR was repeated three times on different experiments and this result is representative. B: Densitometry measurements using 18S RNA as the control gene. Samples were assayed in triplicate and error bars are standard deviations. An asterisk ("*") indicates p<0.001 compared to control, t test; double asterisks ("**") indicate p=0.008, t test.