![]() Figure 4 of
Leske, Mol Vis 2004;
10:43-50.
Figure 4 of
Leske, Mol Vis 2004;
10:43-50.
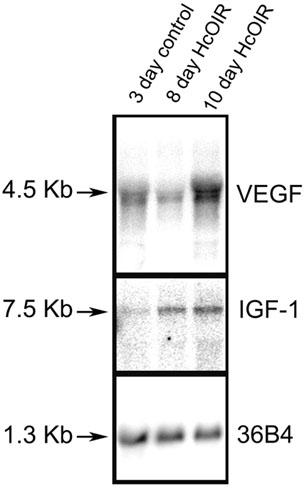
Figure 4. Representative Northern blots for VEGF and IGF-1
Representative phosphorimages of Northern blots shown for VEGF (top), IGF-1 (middle), and 36B4 (bottom). Expression was quantified using ImageQuant software. Total RNA content was normalized between samples to 36B4. VEGF or IGF-1 mRNA expression levels were represented as a ratio of VEGF or IGF-1 signal to 36B4 signal in arbitrary units and normalized relative to the 3-day control VEGF/36B4 or IGF-1/36B4 ratio on the same blot (note first lane).