![]() Figure 2 of
Leske, Mol Vis 2004;
10:43-50.
Figure 2 of
Leske, Mol Vis 2004;
10:43-50.
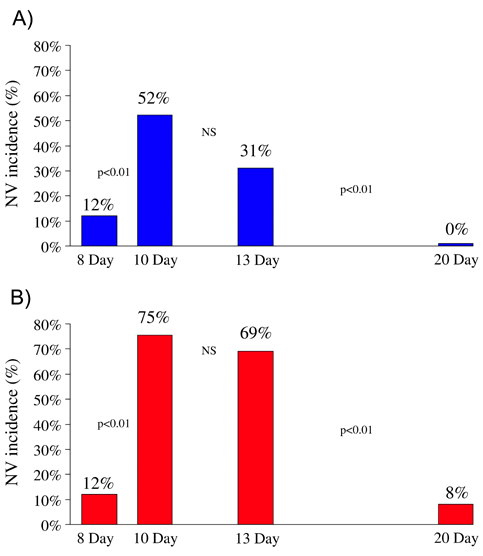
Figure 2. Incidence of neovascularization in normocarbic OIR and hypercarbic OIR by day of life
Incidence of neovascularization for normocarbic OIR (A) and hypercarbic OIR (B) at days 8, 10, 13, and 20. Neovascularization emerges at day 8 (during oxygen exposure) in both normocarbic OIR and hypercarbic OIR. Neovascularization peaks at day 10 in normocarbic OIR and hypercarbic OIR. By day 20, neovascularization has essentially regressed in both models. P values are for comparisons of incidence between consecutive times indicated. NV refers to neovascularization. Non-significant comparisons are labelled "NS" (p>0.05).
