![]() Figure 3 of
Rollin, Mol Vis 2004;
10:450-457.
Figure 3 of
Rollin, Mol Vis 2004;
10:450-457.
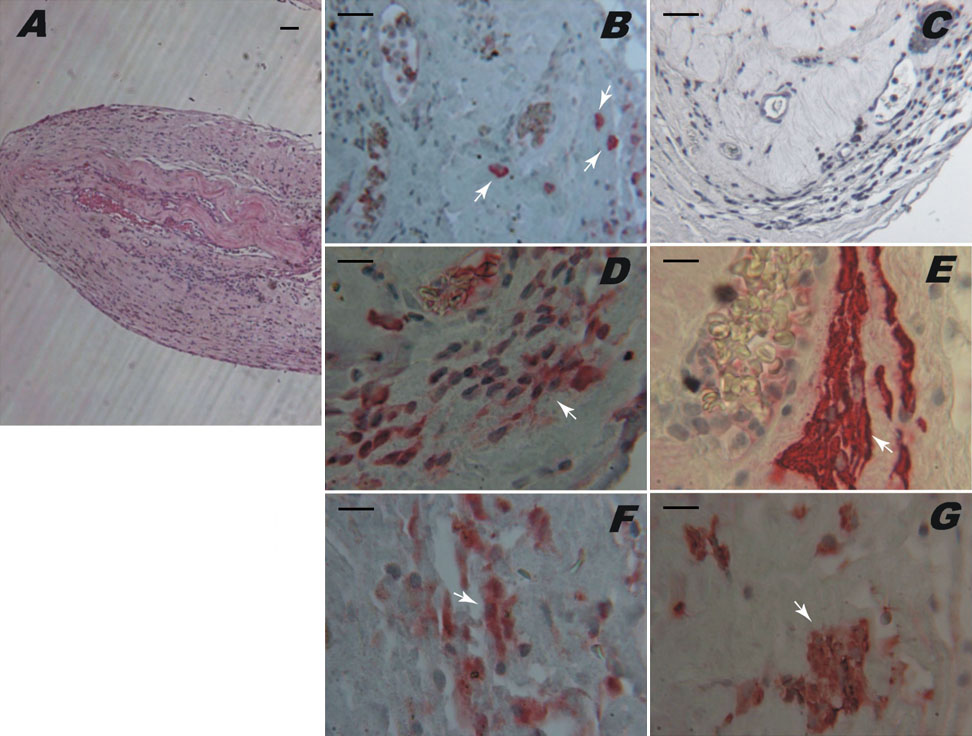
Figure 3. ANP, GFAP, and cytokeratin immunoreactivities in epiretinal membranes
A: Hematoxylin and eosin. Scale bar represents 100 μm. B: Positive staining for ANP shown by macrophages (arrows). D, E: Positive staining for both ANP and GFAP shown by glial cells. F, G: Positive staining for both ANP and cytokeratin shown by RPE cells. C: Positive immunostaining was abolished when the adjacent sections of the same membrane were incubated either with anti-ANP antibody adsorbed with 10 nM ANP or with normal rabbit serum instead of primary antibody. Scale bar in B-G represents 50 μm. Sections counterstained with Mayer's Hematoxylin.