![]() Figure 1 of
Rollin, Mol Vis 2004;
10:450-457.
Figure 1 of
Rollin, Mol Vis 2004;
10:450-457.
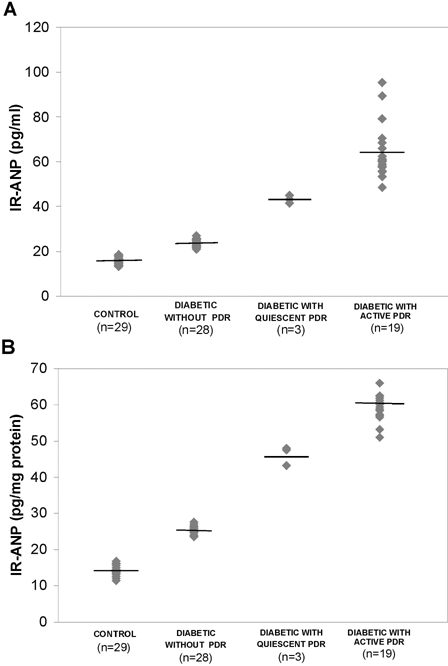
Figure 1. Vitreous humor ANP levels in diabetic patients with and without PDR and in non-diabetic patients
Vitreous humor ANP levels in diabetic patients with and without PDR and in non-diabetic patients. A: ANP levels are expressed as IR-ANP pg/ml. B: ANP levels are expressed as IR-ANP pg/mg intravitreous protein. The concentration of ANP in the humor vitreous remained high in diabetic patients after adjusting for intravitreous protein concentration. The horizontal bars mark the mean of each group. The table below summarizes all possible statistical comparisons (Mann-Whitney U test, Bonferroni correction) between the groups. All six p-values in the Table represent a significant difference after the Bonferroni correction.

                           Diabetic
               --------------------------------
               No PDR    Quiescent   Active PDR
------------   -------   ---------   ----------
Non-diabetic
  Controls     <0.0001     0.005      <0.0001

Diabetic
  No PDR        -          0.005      <0.0001

  Quiescent     -            -         0.006
|